

No 6 (2019)
View or download the full issue
PDF (Russian)
Territorial Organization of Society
- The administrative conversion of 2.4 million people from urban into rural residents has led to the statistical misrepresentation: in many regions of Russia, instead of a real decrease in rural population numbers in 1989 to 2010, the statistical data showed the increase.
- The former urban-type settlements are losing people faster than rural areas of the respective regions, while the population of former urban-type settlements is older.
- Among the former urban-type settlements, the centres of municipal districts have the lowest rates of outmigration and are the largest ones, while the logging centres, the construction centres, and settlements with prisons have the most intensive outflow of people.
18-34 1925
Abstract
Since the 1920s, when the notion of “urban-type settlement” (UTS) was introduced in Russia, and until the 1980s the number of UTSs was constantly increasing. But since the 1990s, their rapid decline began, and by 2019 more than a third of them were transformed into rural settlements. In this article, the authors try to find out what the “new villages” – the former UTSs are; where they are located; what their functions (largely lost) are, and what the specific features of their population are. From 1989 to 2010, the processes of transformation of UTSs into rural settlements administratively increased rural population of Russia by 2.4 mln people and held back the growth of the urban population share, which increased only slightly from 73.4 to 73.7%. When comparing the census data of 1989 and 2010 in many regions, the “administrative ruralization” radically changed the dynamics of the population: instead of a real decrease in the number of rural residents, Census-2010 showed the increase of rural population. Former UTSs are losing population more rapidly than the rural areas of their municipal districts, and the most intensive outflow is in logging settlements, centers of construction and colonies-settlements. The average population size of the former UTSs is minimal in the North of European Russia and the Far North, and maximum in the European South and in the Ural-Volga area, where the former UTSsdistrict centers are mostly concentrated, in which change of their status was purely formal.
- Regions with a low level of transport development have a lot of shadow transportation types.
- The pronounced hierarchy of the system of roads, ways, paths, and routes is typical for Siberia and Far East of Russia.
- Water transport and air transport have the greatest potential in the eastern regions of Russia, but both of them show the most crisis tendencies nowadays.
- Republic of Sakha (Yakutia) and Magadan region are characterized by a combination of marginal areas of transport development along key roads with extensive undeveloped transport zones, where mesoregional and local air hubs are connected to the regional centre.
- Case studies are characterized by low reliability of transportation, associated with a high share of irregular and shadow passenger traffic, insufficient quality of road infrastructure, seasonality of communication, a lack of alternative modes of transport on most routes, which leads to monopolization and to the rising cost of transportation.
35-52 1666
Abstract
Paper analyzes the internal and external connection of passenger transport systems in the Eastern regions of Russia. Key regions with medium and low levels of development are Krasnoyarsk krai, Republic of Sakha (Yakutia), and Magadan oblast. These regions differ from each other by the situation in the State Transport System and are characterized by significant intra-regional differences in the level and nature of transport connection. Analysis of transport connection and isolation is based on the author’s methodology. The proposed approach includes not only analysis of statistics, frequency, time costs and tariffs for all types of passenger transport in the regions, but also qualitative sociological methods – in-depth interviews with passengers and employees of transport terminals. The differences in accessibility of the main settlements of the regions are determined. Low regularity of communication, absence of alternatives along many routes, episodic and insufficient reliability of transport due to seasonality, and important role of shadow forms of transport services were revealed in public transport systems of studied regions.
- In the post-Soviet period, migration determines the dynamics of the population in the Russian Far East.
- The state’s attention to the development of the Far East has been growing over the past few years, but net migration indicators remain negative.
- The needs of the regions of the Far East in labour migrants will increase in connection with the implementation of investment projects.
53-67 1155
Abstract
The article analyzes regional features of migration processes dynamics of in the Far East of Russia in the post-Soviet period (1992–2016). Indicators of migration intensity for migrant arrivals and departures, migration effectiveness and impact of migration flows on the whole Far Eastern region and its subjects were considered. It is shown that until 1997 in the Far East’s migration turnover the largest share of migrants moved within Russia (excluding Far Eastern federal subjects), however, since 2000 to the present time, the intraregional flow of migrants exceeds the total share of interregional and international migrants. As part of the assessment of internal labor migration, federal subjects of the Far East with maximum and minimum sizes of population engaged in labor activity outside the region of residence were identified. The study of the dynamics and territorial structure of international labor migration for the period 2010–2015 reflects the loss of the Far East leading positions in the number of attracted labor immigrants among the federal districts of the Russian Federation. It is established that in most federal subjects the number of migrants working based on patents prevails. Formation of various approaches at the federal and regional levels to the practice of attracting migrants to the labor market in the Far East is shown based on the analysis of the implemented measures of migration policy from 2013 to 2017.
Theory and Social Functions of Geography
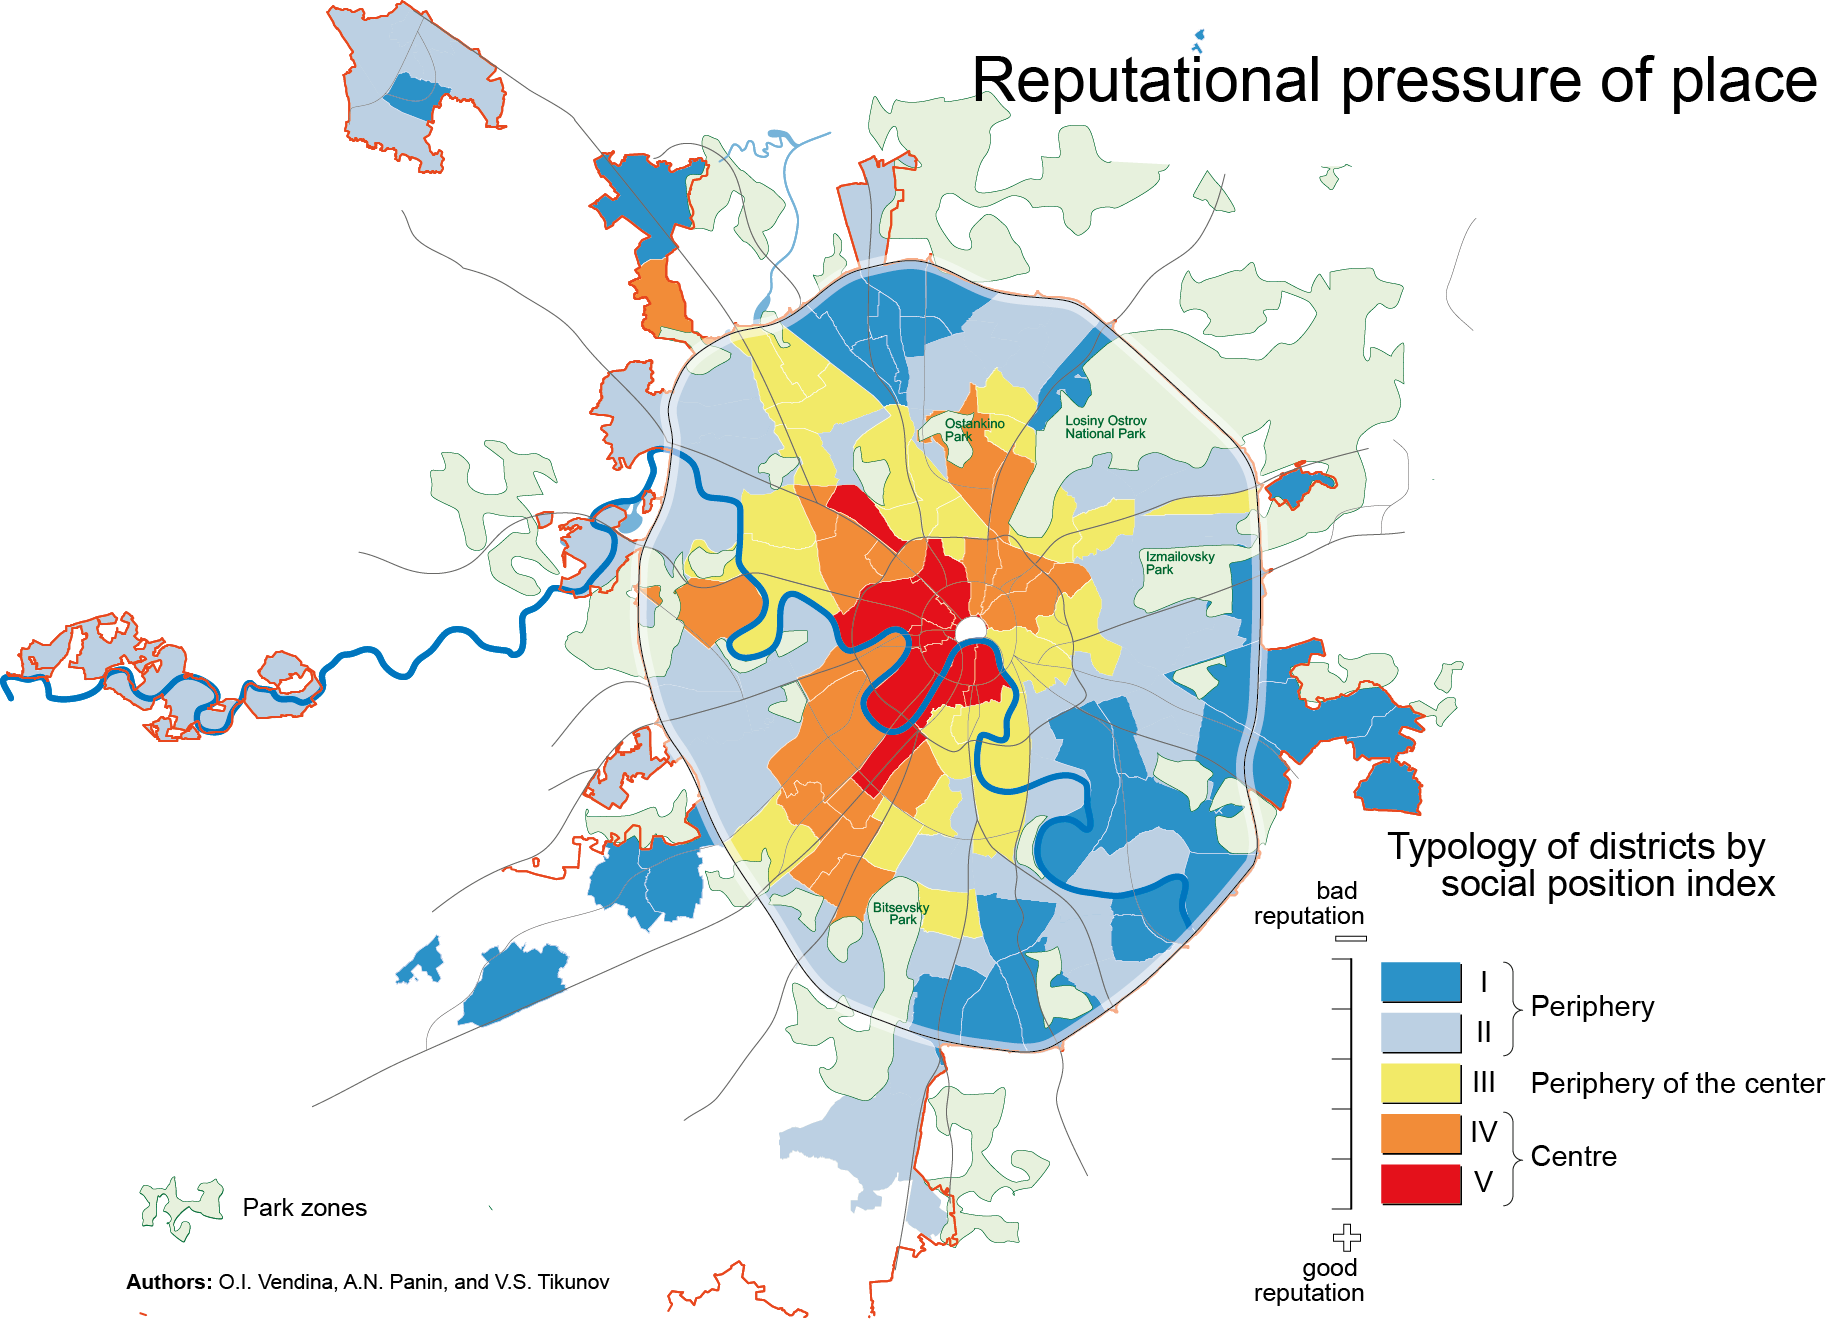
- The trajectory of Moscow urban policy goes from a soviet egalitarian urban planning to business-oriented one and then to the ideas of new urbanism.
- Social and economic fragmentation and polarization resulted in differentiation of Moscow urban environments.
- GIS-models, based on statistical and sociological data, revealed the distinct features and structures of the Moscow social space.
- The indices of the ethnic mosaic, the quality of the urban environment, residents’ dissatisfaction, and the reputation of place were calculated and analysed.
3-17 7620
Abstract
The article presents results of the research project aimed to explore intra-urban differences in Moscow. The concept of “social space” – a dual reality, which is derived from both social relations and territorial characteristics, was employed as a theoretical background of the research. Various quantitative parameters for each of 125 Moscow municipal districts were used. They include data of Census-2010, current socioeconomic and demographic statistics, migration data, results of recent electoral campaigns, real estate indicators and local survey data. The indexes of ethnic diversity, demographic shifts, urban environment diversification, people feelings, and place reputation were calculated. A few classifications of Moscow districts are proposed. Maps showing different dimensions of the social space of Moscow are presented. The comparative analysis of the constructed images reveals an increasing fragmentation and polarization of Moscow social space: the cleavages became more apparent, the socio-spatial gradients have risen. The inequality strengthening led to a tangible division in the level of amenities by municipal districts, to the improvement of urban environment and increase in benefits in some areas, and stagnation in another. The authors conclude that politics targeted at improving the connectivity of the urban spaces and the social milieus, as well at adjusting diversity of urban environment with diversity of urban population, is required to reduce a risk of segregation. This kind of politics and activities is most in demand in the areas where the growth of ethnic and cultural diversity of local residents takes place in the context of development deficiency, relative isolation, and social exclusion.
Natural Processes and Dynamics of Geosystems
- Suspended sediments in the lower reach of the Yenisei River originate either from local bed scouring and bank erosion or from major tributaries, e.g. Nizhnyaya Tunguska.
- Mean annual suspended sediment flux of the Yenisei River is 8.1 ± 0.5 million tonnes; that is about 1.5 times higher than the 1970–2001 average value.
- The officially published data on water turbidity of the Yenisei River in Igarka underestimate the annual suspended sediment flux by 3 to 5 times.
68-82 859
Abstract
Field studies, including high-frequency sampling for suspended sediment flux estimation, were conducted in 2014–2016 in the city of Igarka, at the outlet of the Yenisei River. During spring freshet of each year, multiple suspended sediment concentration (SSC) peaks were observed, irrelated to water discharge fluctuations. The form of hysteresis loops evidences the importance of input from local in-channel sediment sources, i.e. banks and bedforms, and scouring of bed material, deposited during winter, in observed sharp SSC peaks. On the falling stage of the freshet, longer peaks are related to sediment waves from major tributaries, notably the Nizhnyaya Tunguska River. Annual sediment load was calculated based on the daily water discharge and observed SSC data, using sediment rating curves and LOADEST models as two reference methods. Mean annual suspended sediment load of the Yenisei River in Igarka is estimated at 8.1 ± 0.5 mln t., which significantly exceeds previously published values for the 1970–2001 period, from 4.6 to 5.9 mln t. Cumulative sediment load for 2014–2016 totals 24.2 ± 2.1 mln t.
- A transformation of conjugated braided patterns of the Lena River took place due to an increase of water discharge and thawing of frozen bed materials.
- The most complicated in morphology and channel changes sub-parallel braided reach has been formed.
- The channel changes are displayed by the transgressive movement of islands, intensive bank erosion, and formation of shallows. This led to the difficulties and emergency situation in water and transport use of the river.
83-96 934
Abstract
The article considers the conditions of conjugate branches’ system transformation into parallel-branched channel, which are the most complex morphologically (by the mode of deformations and management) on the example of the Pokrovsko-Yakutsky section of the middle Lena River basin in the 21st century. It may arise from the general increase in the Lena River’s water content and thawing frozen soils (composing shallow waters and near-shore shallows), as well as from the development of sleeves with unstable channel. At the same time, local conditions encouraged to the formation of a complex single (three-arm) branching at the beginning of the expansion of the valley bottom and the channel below city of Pokrovsk, the preservation of a straight unbranched channel upstream, the channel of the same type below the Tabaga Cape and alternating one-side branching at the end of the site. The modern riverbed reformation after the changes occurred consists in the transgressive displacement of floodplainisland massifs, intensive banks’ erosion, and the sediment accumulation zones’ formation. This has led to the significant complications in the river water usage (including water intake and port water areas’ sedimentation, creation an unfavorable environment in the port approaches area, berths and industrial infrastructure) and to creation of an emergency situation at the coastal infrastructure facilities. The revealed channel deformations’ regularities on the basis of long-term and modern researches and hydrodynamic modeling allowed to develop and justify the complex scheme of channel processes’ management, which implementation will allow to reduce or neutralize their adverse or dangerous manifestations.
Natural Recourse Use and Geoecology
- Of the 45 million hectares of FSC certified forests in Russia, about 6 million hectares of high conservation value forests (HCVF) were voluntarily set aside from forest management as part of certification obligations. Officially protected areas were established on 0.15 million hectares of certified forests.
- Within the framework of FSC certification in Russia, companies voluntarily protect about 1 million ha of intact forest areas (IFL), that is about 30% of all IFL leased from certified companies.
- In the Northwestern Federal District of Russia, the share of HCVF of categories 1–3 with a management regime close to protected areas is 7.2% of the certified leased area, which roughly corresponds to the share of protected areas of the total land area (7.8%).
- FSC certification almost doubles the area of protected forests in the North-West of Russia.
- FSC forest certification is becoming the main mechanism for the conservation of forests in regions of intensive forest management of Russia.
97-106 659
Abstract
Forests of Russia have global ecological significance. They include huge massive of boreal forests, almost a quarter of global area of intact forest landscapes. The global role of Russian forests in inhibition of aridization and land degradation is well known. Development of representative system of forest protection is one of the main tasks of Russian Federation in implementation of the Convention on Biological Diversity obligations. The Strategic Plan for Biodiversity 2011–2020 and the Aichi Strategic Goals plan protection of no less than 17% of terrestrial ecosystems’ area to the 2020, especially the sites of high significance for biodiversity and ecosystem services. The main forest protection mechanisms are protected natural areas (PNA), forests with protective functions, and protective sites (PS). PNA contains around 7% of forest covered area. Forests with protective functions make up around 16% of forest covered areas, but the management regimes of many types of such forests are not conforming to the Aichi Biodiversity Targets. Many of forests with protective functions are under lease for forest management. Since recently the significance of voluntary Forest Stewardship council (FSC) certification for biodiversity conservation is increasing. The standards of FSC certification require from forest companies to implement protection and appropriate use of high conservation value forests (HCVF). Totally there are 46 mln ha of FSC certified forests in Russia, from them around 5–6 mln ha of HCVF received additional protection from certification. One of the most important categories of HCVF are intact forest landscapes (IFL’s). Around 1 mln ha of IFL’s are protected as the result of forest certification, providing significant input into Convention on Biological Diversity. For 35 FSC certified companies the share of identified HCVF’s with nature conservation regimes in their leased forests is comparable with the average share of PNA’s (without certification) on the regional or district level. The main output of the research is that the role of voluntary forest certification for enhancing the system of forest protection in Russia is increasing, which receives worldwide recognition.
Regional Geographical Problems
- The concept of stability/instability is suitable for comparing spatial dynamics of population and for identifying viable/non-viable settlements.
- The districts with a comparatively large share of the indigenous population in Chukotka were characterized by greater stability thanks to the smaller population decline and the lack of abandoned settlements.
- The areas with formerly newcomers and those with resource mining points showed the greatest instability.
- Most of the single-industry towns were led to non-viability and were abandoned before 2000.
- Differences in stability/instability are pronounced during the years of crisis and are cancelled out during the periods of stable development.
107-125 1048
Abstract
The aims of the study are twofold. First, it aims at identifying geographical characteristics and differences in the stability/instability of population dynamics. Second, the paper examines the sustainability of settlements in the ethnic region in the Arctic Circle and the factors that determine them. Traditional geographical approaches and the field research enabled us to clarify general instability of the population dynamics and the settlements of Chukotka in the 1990s and its stabilization seen after 2002, although there were significant differences at the intra-regional and local levels. Relatively greater stability (a smaller decrease in the population due to a smaller migration outflow and the absence of abandoned settlements) was seen in the population and settlements in regions with high percentage share of indigenous people. The most unstable areas were those with a large share of the newcomers and those with the mining industry, especially in the 1990s. The extremely and most vulnerable was single-company towns which closely connected with mining enterprises, most of which were eliminated before 2000. Differences in stability/instability of population dynamics and local settlements, or differences in resilience/vulnerability of the system at different spatial levels (from regions to individual settlements) will become more evident in the years under crisis but will be smoothed out during the period of relatively stable development.
T. S. Gubareva,
B. I. Gartsman,
V. V. Shamov,
T. N. Lutsenko,
A. G. Boldeskul,
N. K. Kozhevnikova,
S. Yu Lupakov
- In the case of landscape uniformity of a catchment (Medvezhiy Creek), the hydrograph separation includes: rain component, baseflow, and water component from the surface soil organic layer.
- If the landscape structure of catchment is heterogeneous (Elovy Creek), the soil component in river water is divided into independent components namely soil water from the organic layer and soil water of the mineral layer.
- The soil mineral component in the runoff is due to the spread of landscapes of the cold upper belt of fir-spruce forests, the soils of which are characterized by a lower rate of organic matter destruction and a deeper illuviation process of dissolved organic carbon (DOC).
126-140 655
Abstract
The article summarizes results of the systematic study of the streamflow formation of two small catchments in the upper part of the Ussuri River. The study was carried out by the hydrograph separation technique (using detailed data of the hydrochemical and hydrological monitoring) and the use of a tracer mixing model in conjunction with EMMA. Performed in the period from 2011 to 2016 the studies allowed to calculate the river runoff components of the summer-autumn period at 3 gauge-stations and evaluate their mutual dynamics at different time scales. It is shown that in the case of landscape uniformity of the catchment (the Medvezhiy Creek), the river flow can be represented as a result of 3 sources’ mixing. This, the most common, scheme for the hydrograph separation includes following sources: a direct rainfall flow, an organic soil water component, and an underground baseflow. If the catchment’s landscape structure is clearly heterogeneous (the Elovy Creek), the river flow can be represented as a result of 4 sources’ mixing. In this case, the fourth source appears as a result of the separation of soil water component into individual components – organic and mineral. This separation is due to the spread in the basin of the cold upper belt of fir-spruce forests, whose soils are characterized by a lower rate of organic matter destruction and a deeper illuviation process of DOC. Statistically significant dependencies of the some runoff components’ proportions against river discharges were identified, systematization of which makes them promising for practice in hydrological monitoring and forecasting.
ISSN 2587-5566 (Print)
ISSN 2658-6975 (Online)
ISSN 2658-6975 (Online)


